Machine learning algorithms
Supervised methods
Linear regression
Linear methods are parametric methods where function learned has form 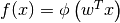 where
where  is some activation function.
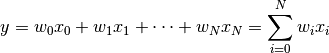
Generally, optimized by learning weights by applying (stochastic) gredient descent to minimize loss function, e.g. 
Simple; a good place to start for a new problem, at least a baseline
Methods: Linear regression for numeric target outcome. Logistic regression for categorical target outcome.
Linear regression (univariate)
Image:univariate.png
Model relation between a single feature (explanatory variable  ) and a real-valued response (target variable
  )
)
Given data  and a line defined by
  (intercept) and
  (slope), the vertical offset for each data point from the line is the error between the true label and the prediction based on
The best line minimizes the sum of squared errors (SSE)
We usually assume the error is Gaussian distributed with mean zero and fixed variance
Linear regression (multivariate)
Multiple linear regression includes  explanatory variables with
  :
:
Sensitive to correlation between features, resulting in high variance of coefficients.
scikit-learn implementation:
sklearn.linear_model.LinearRegression
Logistic regression
Predict whether a credit card transaction is fraud
Image:fraud.png
Estimates the probability of the input belonging to one of the two classes: positive and negative.
Vulnerable to outliers in training data.
Relation to linear model:
 is a trained multivariate linear function
 is a fixed univariate function (not trained)
Objective function to maximize = probability of the true training labels.
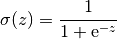
Sigmoid curve. Image: sigmoid.png
Model relation between features (explanatory variables ) and the binary responses ( or
or  )
)
For all features, define the linear combination:

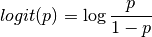
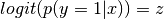
Define the probability of given as  and find the logit of as:
Logistic regression finds the best weight vector by fitting the training data
Then, for a new observation, you can use the logistic function  to calculate the probability to have label
  . If it is larger than a threshold (for example
  ), you will predict the label for the new observation to the positive.
sklearn.linear_model.LogisticRegression
Linear separable versus non-linearly separable
Image:separable.png